In this topic
Collector end-points
No subtopics in thissection
SW_AGENT_COLLECTOR_BACKEND_SERVICES values are based on the IBM webMethods iPaaS Regions :
| Azure End-Point | Value |
|---|---|
| US2 East Azure | uhm.e2em-hybrid-az-us.webmethods.io:443 |
| AU1 Australia East Azure | uhm.e2em-hybrid-az-au.webmethods.io:443 |
| EU3 West Azure | uhm.e2em-hybrid-az-eu.webmethods.io:443 |
| AWS End-Point | Value |
|---|---|
| US1 Oregon AWS | uhm.e2em-hybrid-aw-us.webmethods.io:443 |
| EU2 Frankfurt AWS | uhm.e2em-hybrid-aw-eu.webmethods.io:443 |
| AU2 Sydney AWS | uhm.e2em-hybrid-aw-au.webmethods.io:443 |
Common configurable properties
No subtopics in thissection
Following are the configurable properties in the End-to-End Monitoring agent available at
Installer-based: <INSTALL-DIR>\E2EMonitoring\agent\config\agent.config
Package-based: <INSTALL-DIR>\IntegrationServer\packages\<IS-E2EM package name>\resources\agent\config\agent.config
| Property | Description |
|---|---|
agent.trace_transfer_interval=${SW_AGENT_TRACE_TRANSFER_INTERVAL:180000} |
This property defines the interval between each write operation to the file. The same property is used for data send interval through the gRPC channel. Default value is 18000 ms. It is recommended to reduce this time interval to shorter segment trace writes if you prefer a faster sync time. |
collector.establish_cloud_communication=${SW_AGENT_COLLECTOR_ESTABLISH_CLOUD_COMMUNICATION:true} |
This property defines connectivity with the cloud collector. Default value is true, which means that data is sent to the cloud collector. |
agent.onprem_multitenant_alias |
Hybrid data transfer takes place within tenants of one given region only. When multiple tenant connections are created for different tenants belonging to the same region, specifying one of the tenant connection names for agent.onprem_multitenant_alias in agent.config is sufficient to trace hybrid transactions of other tenants belonging to the same region. However, this is required only if you have multiple tenants in the same region and you want to route the trace using a specific tenant. Note that End-to-End Monitoring can only trace to one tenant but is able to determine the original tenant for each trace. |
agent.global_incl_serv_flag=${SW_AGENT_GLOBAL_INCL_SERV_FLAG:GLOBAL_OR_LOCAL} |
This property allows you to select between IBM Designer audit property or Integration Server extended settings WATT properties based tracing. Default Value is GLOBAL_OR_LOCAL. Possible values are GLOBAL_OR_LOCAL, GLOBAL, LOCAL.
|
agent.exclude_serv_list=${SW_AGENT_EXCLUDE_SERV_LIST:wm.,com.,pub.} |
This property is considered only if WATT exclude is set with $wmservices. $wmservices represents any webMethods services. These service names start with wm. or pub. or com., and are excluded from tracing. |
agent.watt_check_interval=${SW_AGENT_WATT_CHECK_INTERVAL:600000} |
Any changes in WATT property or the content in include or exclude files is refreshed in cache at this interval. Default value is 600000 ms=10 minutes. |
agent.service_name=${SW_AGENT_NAME:ONPREMISEIS} |
Indicates service name that monitors product calls. Set SW_AGENT_NAME to ONPREMISEAPI, to monitor on-premise API Gateway calls. |
agent.onprem_tenant_id=${SW_AGENT_ONPPREM_TENANT_ID:default} |
Indicates cloud tenant from which transactions to on-premise API Gateway takes place. Tenant name is the value for SW_AGENT_ONPPREM_TENANT_ID. |
agent.apigw_tag=${SW_AGENT_APIGW_TAG:<custom tag>} |
End-to-End Monitoring, by default, monitors all the on-premises API Gateway calls with tag e2em. If you need to monitor an API containing custom tags , add this property in agent.config with custom tag value. To enable tracing, add the e2em tags to the API Gateway API, in case you do not have them already. |
collector.backend_service=${SW_AGENT_COLLECTOR_BACKEND_SERVICES: uhm.e2em-hybrid-az-us.webmethods.io:443} |
In case of agent to collector connection issues, this property can be used to set collector endpoint so that the agent can connect to the specified collector. This property is not required to be set explicitly from v10.15 onwards, for v10.11 or v1.3.0 latest fixes (Fix 5 and above). Note: Refer Collector end-point section for specific collector end-point values. |
agent.onprem_multijndi_alias = ${SW_AGENT_ONPREM_MULTIJNDI_ALIAS:DEFAULT_IS_JNDI_PROVIDER} |
This property defines the Multi-JNDI support for specific alias. This property is set to DEFAULT_IS_JNDI_PROVIDER by default. If you use custom JNDI provider alias in the Integration Server, then use the custom name as value instead of DEFAULT_IS_JNDI_PROVIDER. |
agent.onprem_jndi_auth_enable=${SW_AGENT_ONPREM_JNDI_AUTH_ENABLE:true} |
This property defines on-premises to cloud JNDI based authentication. It is set to false by default. |
Configuring proxy
No subtopics in thissection
To configure a proxy server for End-to-End Monitoring agent and collector connectivity:
- Go to your installation directory that contains either of the files
custom_wrapper.conf, orsetenv.sh, orsetenv.bat.
For example:<IS Installation>\profiles\IS_default\configuration - Edit the file based on your installation:
custom_wrapper.confor
setenv.shor
setenv.bat - Search for the string:
-javaagent - Append the following code phrase in the same line preceded by a space:
-Dhttps.proxyHost=<proxy server host> -Dhttps.proxyPort=<proxy server port>
Troubleshooting
Where can I find the log files?How can I view traces information in the log files?Are there exception cases where hybrid transaction traces will not work?Detailed step-by-step tutorialWhere can I find the log files?
- Integration Server log file location:
<InstallDir>/IntegrationServer/instances/default/logs - Microservices Runtime log file location:
<InstallDir>/IntegrationServer/logs - On-premises Integration Server transaction traces:
e2etraces.log
How can I view traces information in the log files?
Note
The steps outlined below are applicable only if you have already completed the configuration for hybrid monitoring with Integration Server or with API Gateway.
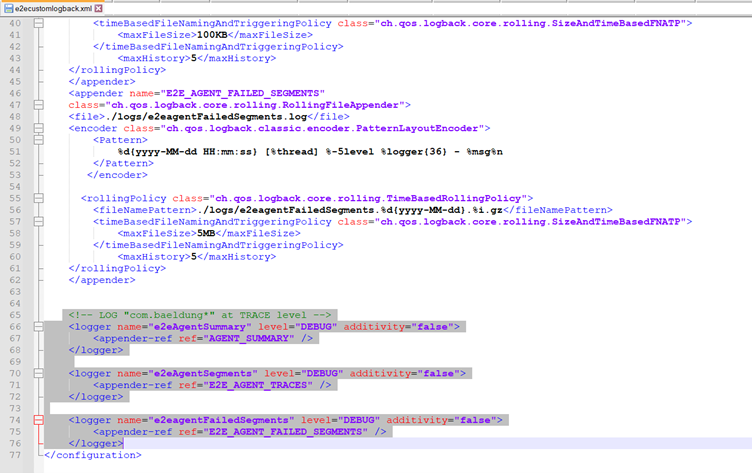
Go to the file
e2ecustomlogback.xmlat the following location:Integration Server
<INSTALL-DIR>\IntegrationServer\instances\defaultMicroservices Runtime
<INSTALL-DIR>\IntegrationServer
NoteIf you cannot locate the filee2ecustomlogback.xmlin the installation, then install latest fixes.Apply the DEBUG logging level to the following properties:
"e2eAgentSummary" level="DEBUG"
"e2eAgentSegments" level="DEBUG"
"e2eagentFailedSegments" level="DEBUG"

Here is a sample of the on-premises transaction trace:
2021-08-06T19:49:50,328 DEBUG [e2eAgentAppender] -
[ENTRY]SpanInfo [traceId=[26655816.49441.45841902585488], segmentId:26655969.276.162825958992328, spanId:0, serviceName=forTesting:javaAsyncService1, startTime=1628259589923, duration=4ms, component=ONPREMISEIS, tenant=VMWODEPLAT01:5555, status=Success, requestID=5745b59f-089a-4b13-9038-f82188d68a32, parentLandscape=WMIO]
Are there exception cases where hybrid transaction traces will not work?
- The trace cannot be guaranteed to be coherent if you have child services that are audited, but called from a parent service that is not audited.
Detailed step-by-step tutorial
For a detailed tutorial, see Step-by-Step Tutorial - Hybrid Monitoring.