Release 10.16.0
Explore the release highlights, usage notes, and known issues for webMethods.io API Control Plane 10.16.0
Explore the release highlights, usage notes, and known issues for webMethods.io API Control Plane 10.16.0
| Issue ID | Description |
|---|---|
| WCO-2889 | Accessibility related issue is found in the Action menu of the Manage runtime and Manage Data plane pages. This issue is resolved. |
| WCO-2957 | The world map in the Dashboard page displays incorrect runtime details. In the world map view, when you click > next to the Data Plane to view its associated runtime and if you click > next to another Data Plane without closing the first data plane details, API Control Plane displays the details of the first data plane details instead of second one. This issue is resolved. |
| WCO-3112 | The availability widget in the overall and specific runtime monitor screen shows incorrect results. This issue is resolved and the availability widget shows a value equal to or less than 100% now. |
| WCO-3097 | Average response time and latency trend are computed incorrectly. Dashboard page displays incorrect average response time and latency trend. This issue is resolved. |
| WCO-3076 | The availability widget graph is not rendered on the overall and specific data plane monitoring screens. This issue is resolved. |
| WCO-2904 | The following alignment issues in API Control Plane UI are fixed:
This issue is resolved. |
| WCO-2965 | To enhance the user experience, tool tips are introduced for the status widget in the monitoring screens. |
| WCO-2966 | To enhance the user experience, tool tips are introduced for the performance widget in the monitoring screens. |
| WCO-2967 | To enhance the user experience, the highlight functionality is introduced in the status and performance line charts in the monitoring screens. |
| WCO-3101 | Error rate is computed incorrectly. Runtime and Data plane monitoring pages display incorrect error rate. This issue is resolved. |
| WCO-3102 | Different trend values appear in the Monitoring and Dashboard pages. When the Monitoring page gets loaded, the trend value gets rounded off to the nearest decimal and displays incorrect value. This issue is resolved. |
| WCO-3110 | Issues with establishing a connection between API Control Plane and runtime. In the agent docker compose file, the ‘apigw_cp_agentConfig_controlPlaneConfig_retry_retryTimeIntervalInSeconds’ property value specified is in seconds. Whereas, API Control Plane agent interprets it in milliseconds. This discrepancy is causing retries to complete quickly, which is resulting in runtime connectivity issues. This issue is resolved. The retry property is now interpreted in seconds and API Control Plane agent retries the connection based on the value configured in the agent docker compose file. |
| WCO-3113 | The availability widget in the overall and specific data plane monitor screen shows incorrect results. This issue is resolved and the availability widget shows a value equal to or less than 100% now. |
| WCO-3079 | In the overall runtime monitoring screen, the status incorrectly shows as ‘amber’ when the runtime is down. The status of the runtime in the overall monitoring screen turns ‘amber’ when it transitions from ‘green’ to ‘red,’ ‘red’ to ‘green,’ or when its sync interval is not defined in minutes. This issue is resolved. |
Runtime refers to an API Gateway deployment. API Control Plane can provide information about the health status of the runtime (whether it is up or down) and data that the runtime handles. With this functionality, you can modify or remove the runtimes, view the runtime details, and the APIs that are deployed in the runtimes.
 Read More
Runtime monitoring enables you to analyze the performance and operation of the runtimes. You can monitor all the runtimes in the landscape by keeping track of how the runtimes are performing, trend analysis, and transaction patterns for the selected time range. You can also monitor individual runtimes to get more information about the runtime’s performance in terms of availability and other metrics.
 Read More
Data plane represents a logical grouping of the runtime that makes sense to the organization. Runtimes can be grouped into data planes based on name, tags, location, region, runtime type, and deployment type. With this functionality, you can manage data planes, view the individual runtimes in the data plane, and their status.
 Read More
Data plane monitoring enables you to monitor and analyze the key performance indicators (KPIs) of data planes. You can monitor the business metrics of all data planes by keeping track of how the dataplanes are performing, trend analysis, and transaction patterns for the selected time range. You can also monitor individual dataplane to get more information about the performance of the runtimes associated to identify the top performing and under performing APIs, which helps you to make informed business decisions.
 Read More
An agent is embedded within API Gateway and periodically sends information from the runtime (API Gateway) to API Control Plane. Once API Gateway registers itself as runtime to the agent, API Gateway starts to send the following data to API Control Plane at regular intervals:
Once the runtime is registered, API Control Plane is auto-populated with the whole list of APIs available in the API Management landscape. API Control Plane provides a way to view how the APIs are associated to the runtimes. It shows how the same API is used by different runtimes. It also highlights the differences that are seen in the API fields. It also navigates you to the API details page in API Gateway.
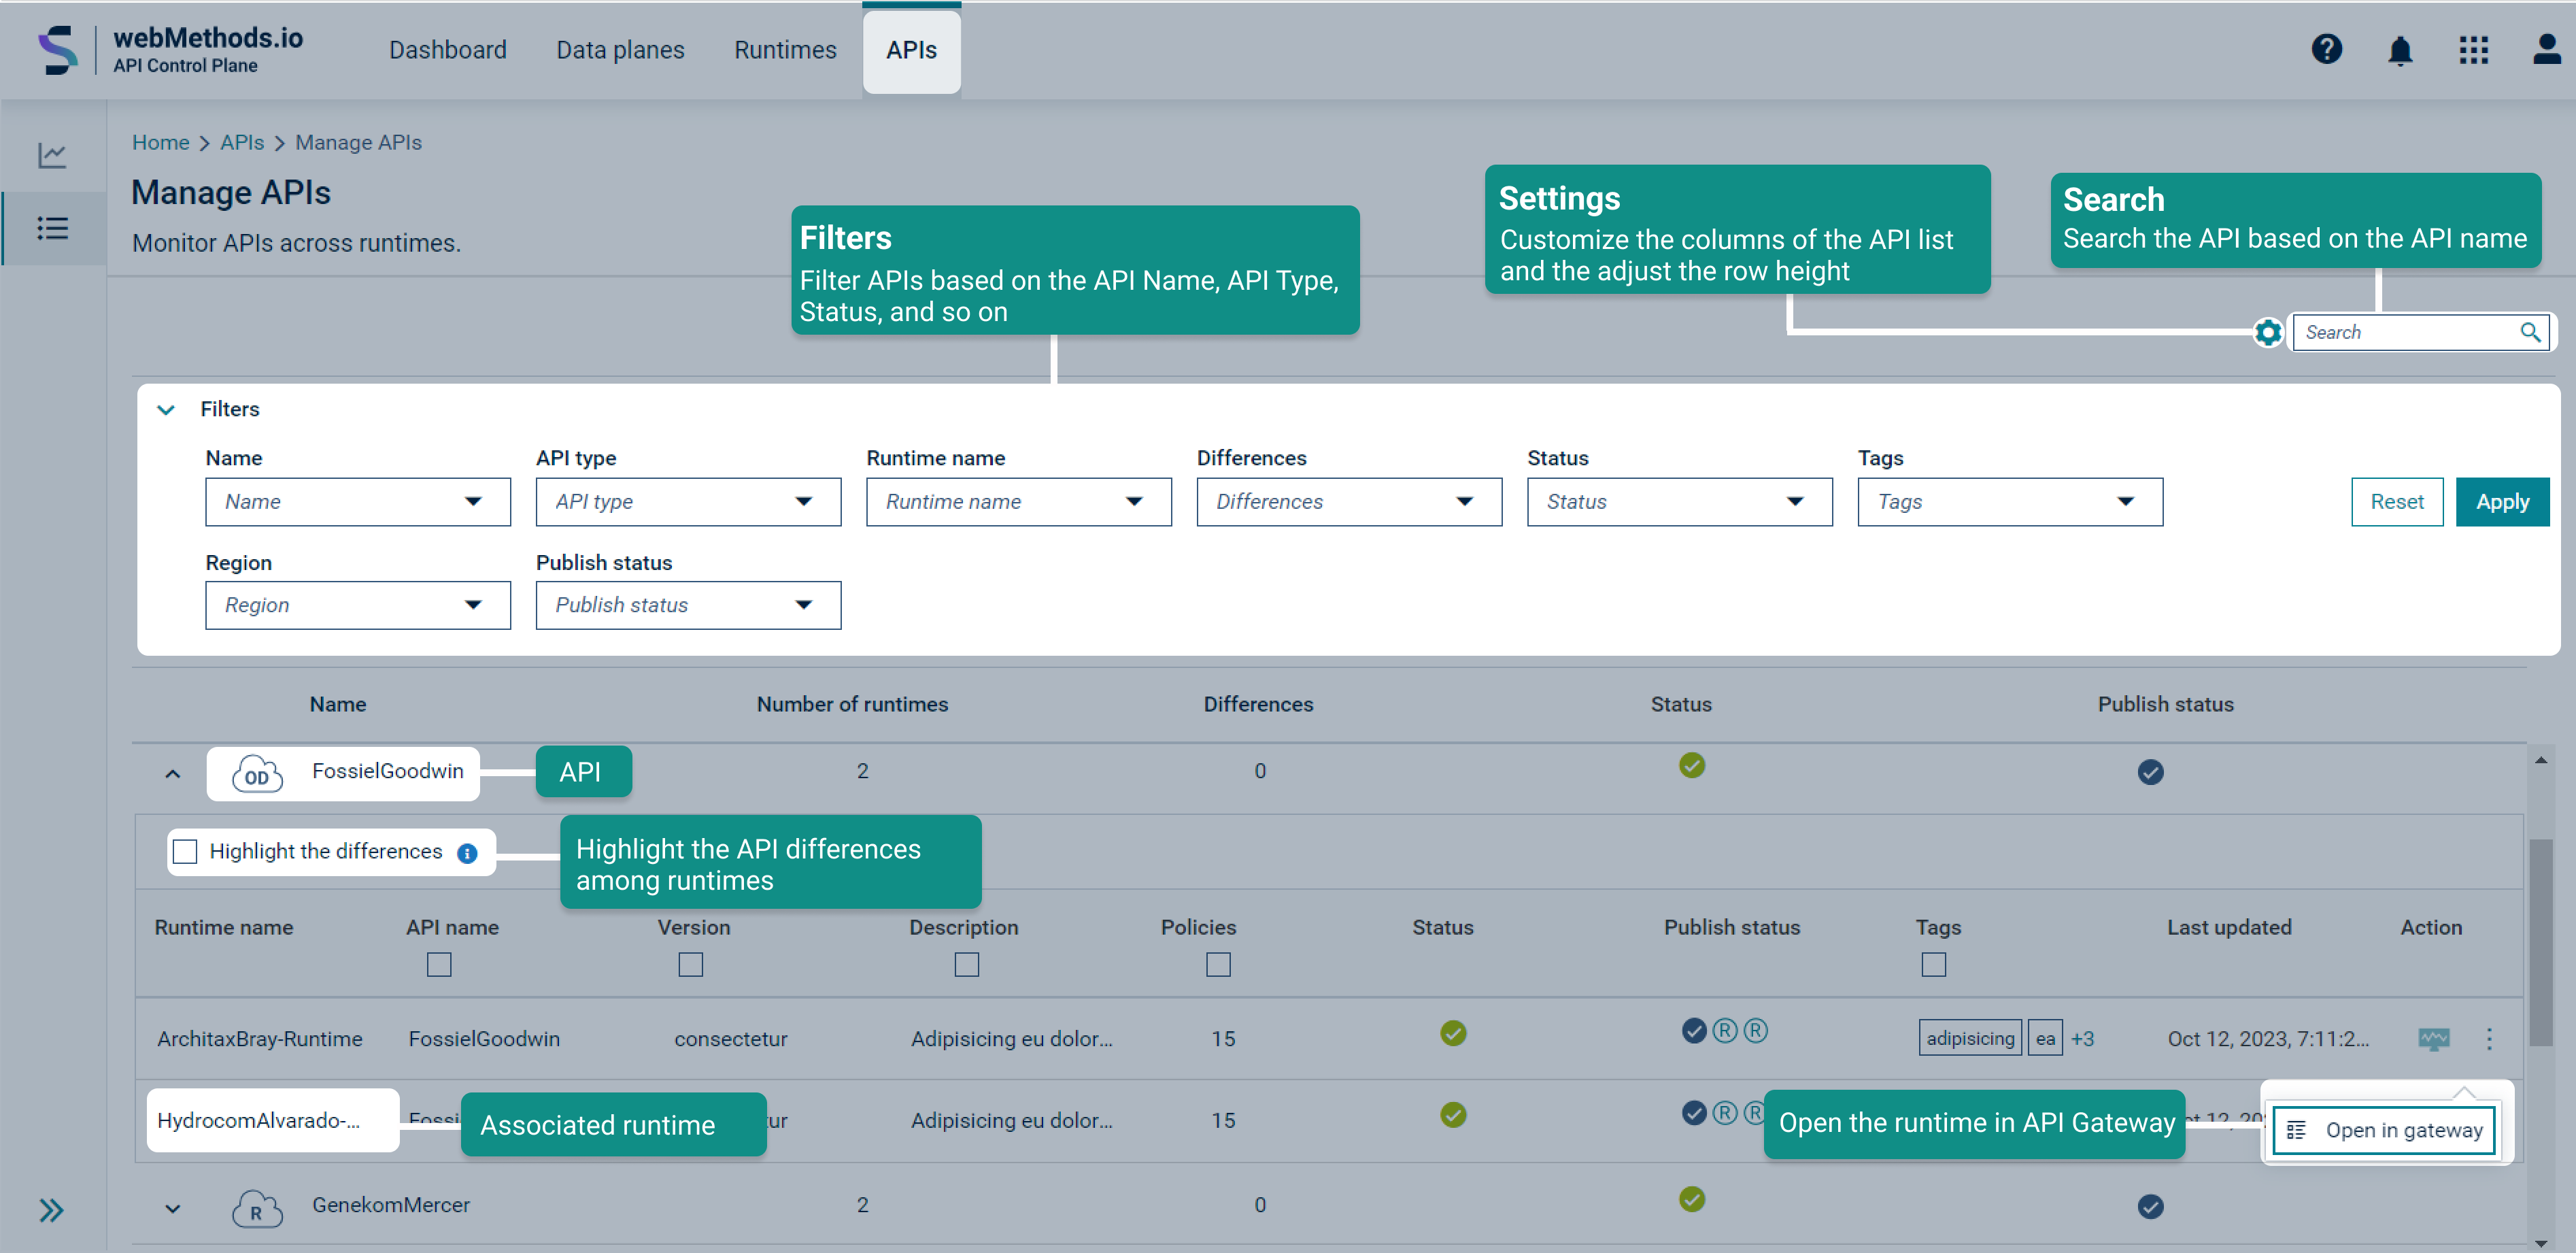 Read More
The dashboard is the landing page for the API platform provider and API product manager user groups. It also provides a holistic view of all the assets in API Control Plane. It enables you to visualize how the data planes and runtimes in the organization are distributed geographically. It shows an overall summarized count of the total transactions, error rate, average response time, and latency for the selected time range. It also shows the recent activities performed based on audit events of the data planes, runtimes, and APIs. The dashboard offers different views based on the user groups:
| API Platform Provider | API Product Manager |
|---|---|
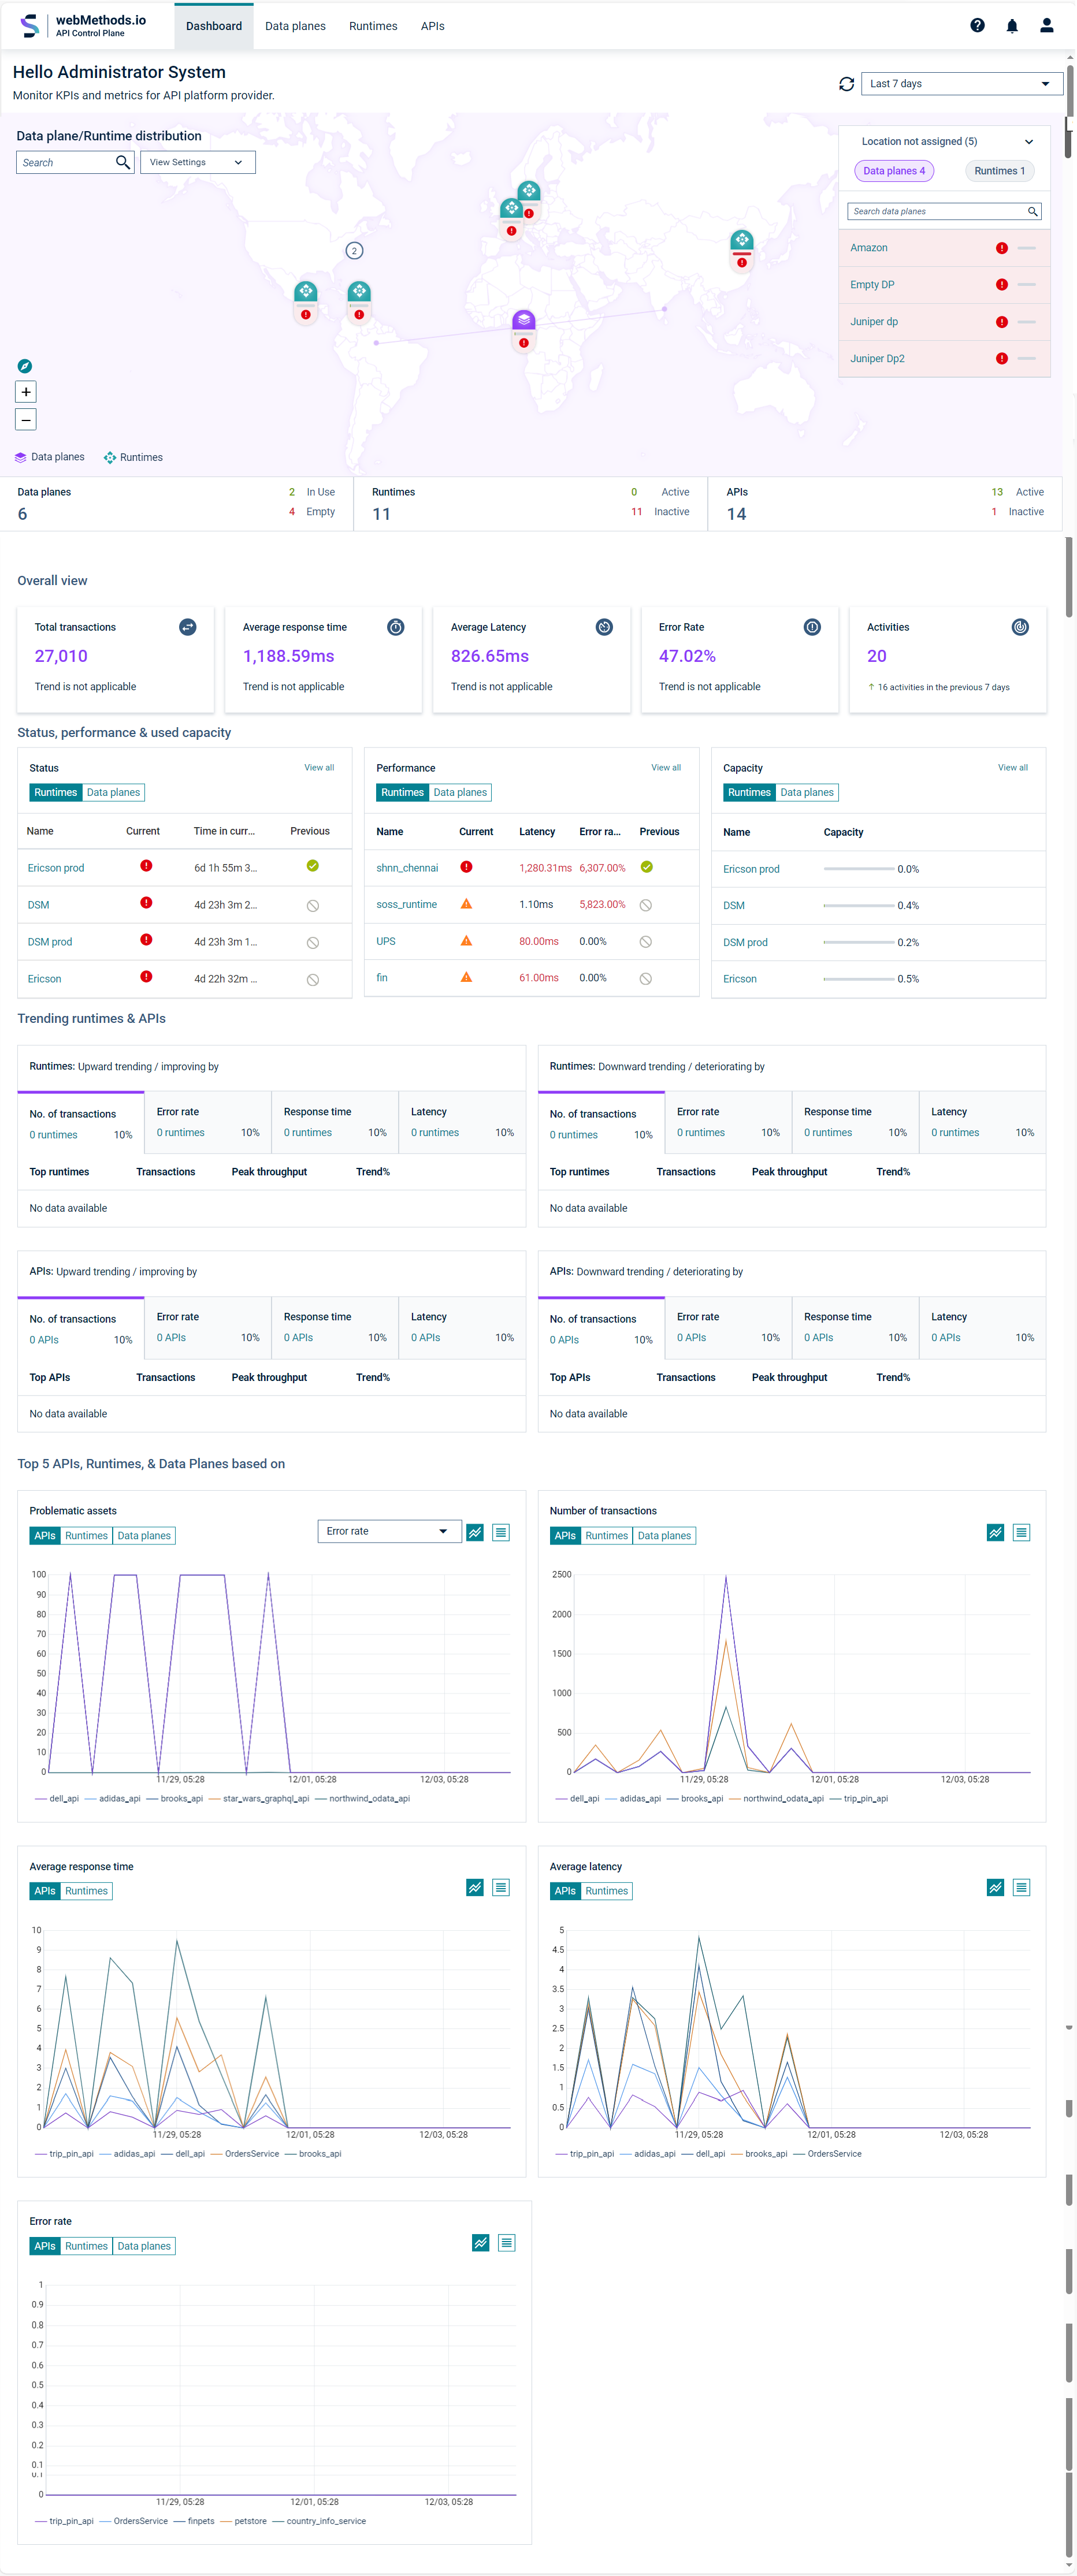 |
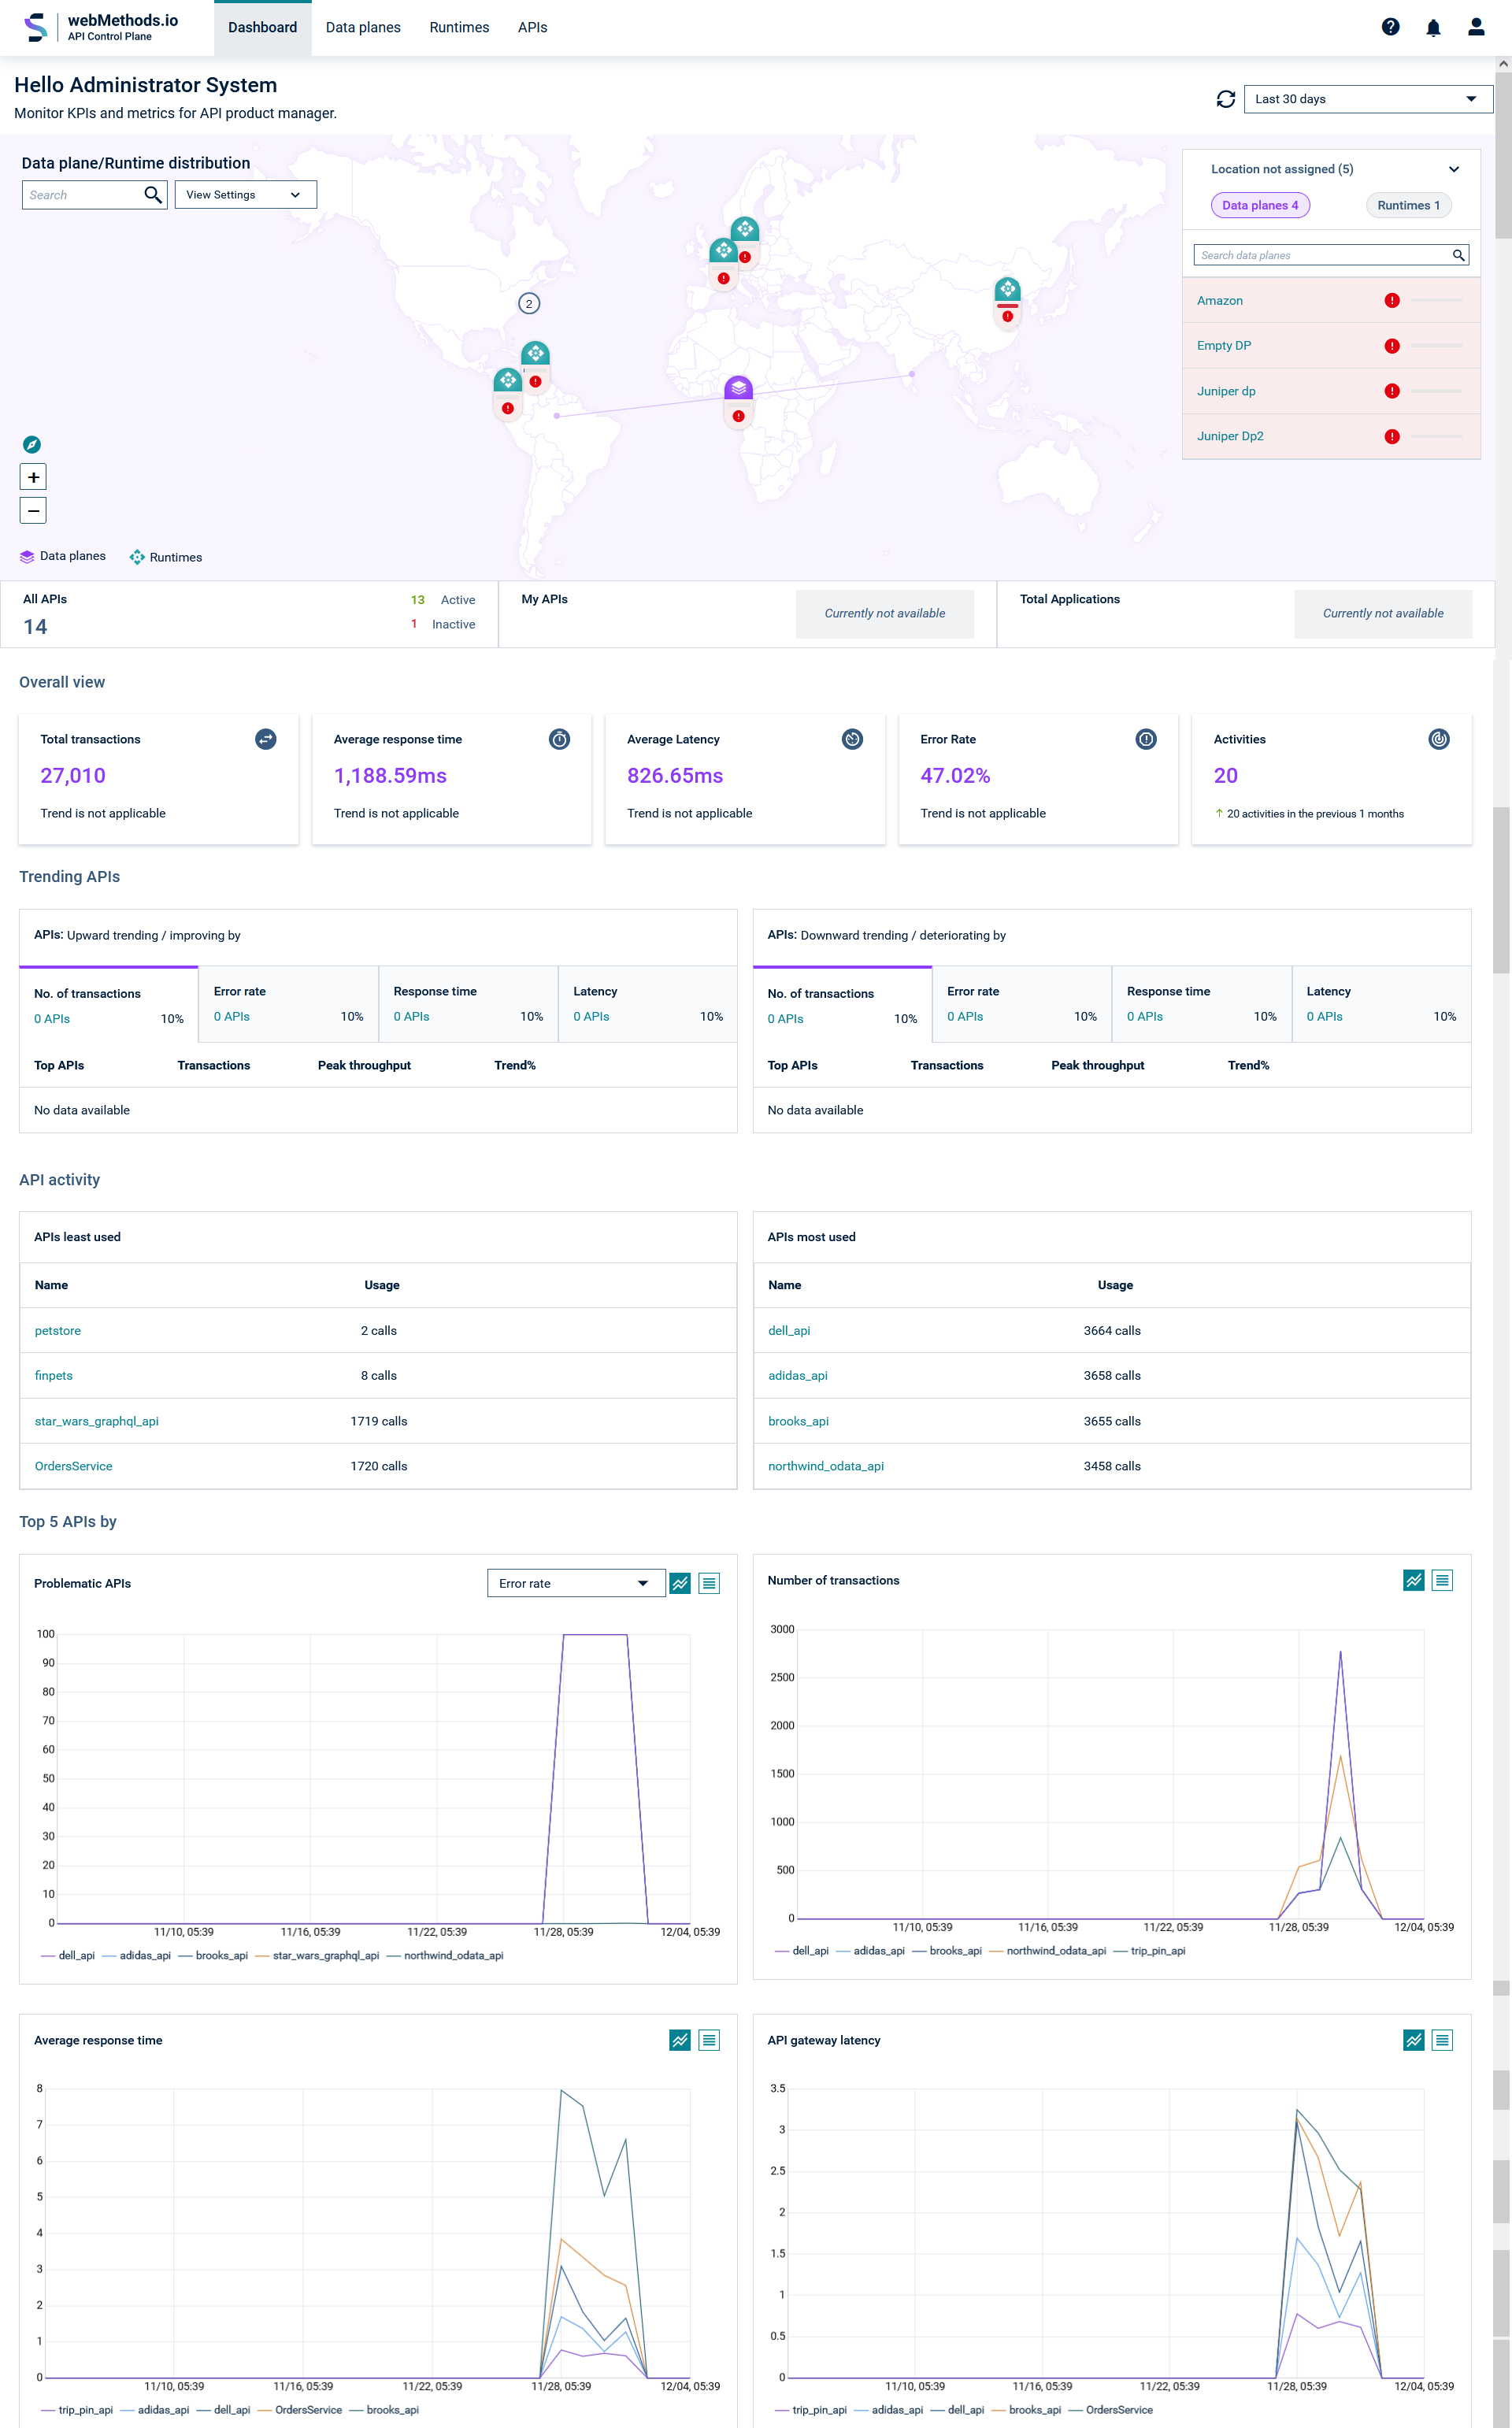 |
API Control Plane enables you to:
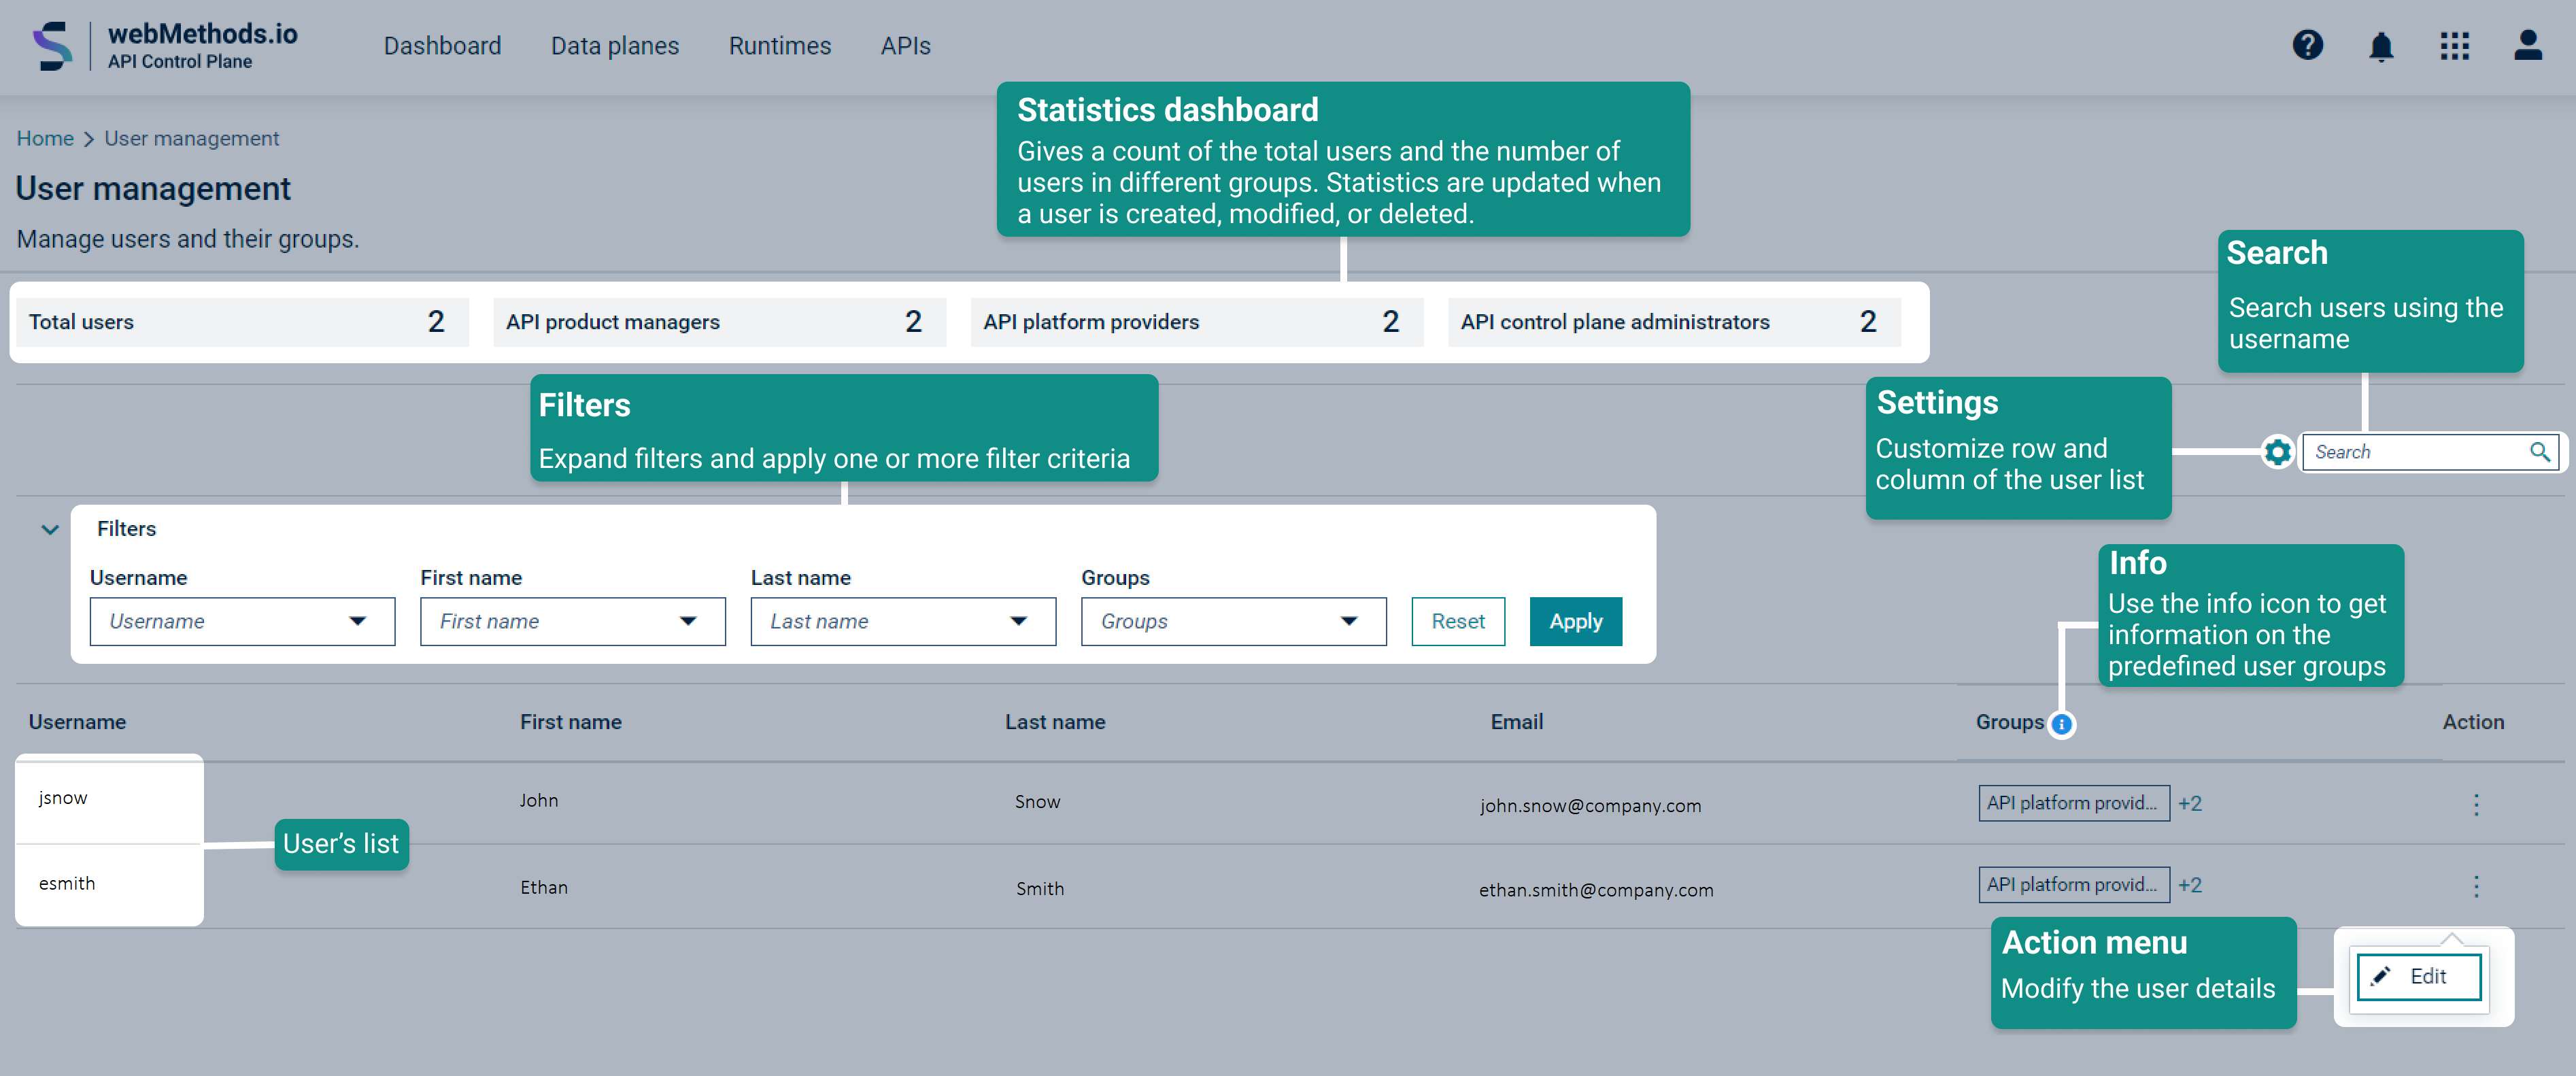
manage the following users groups:
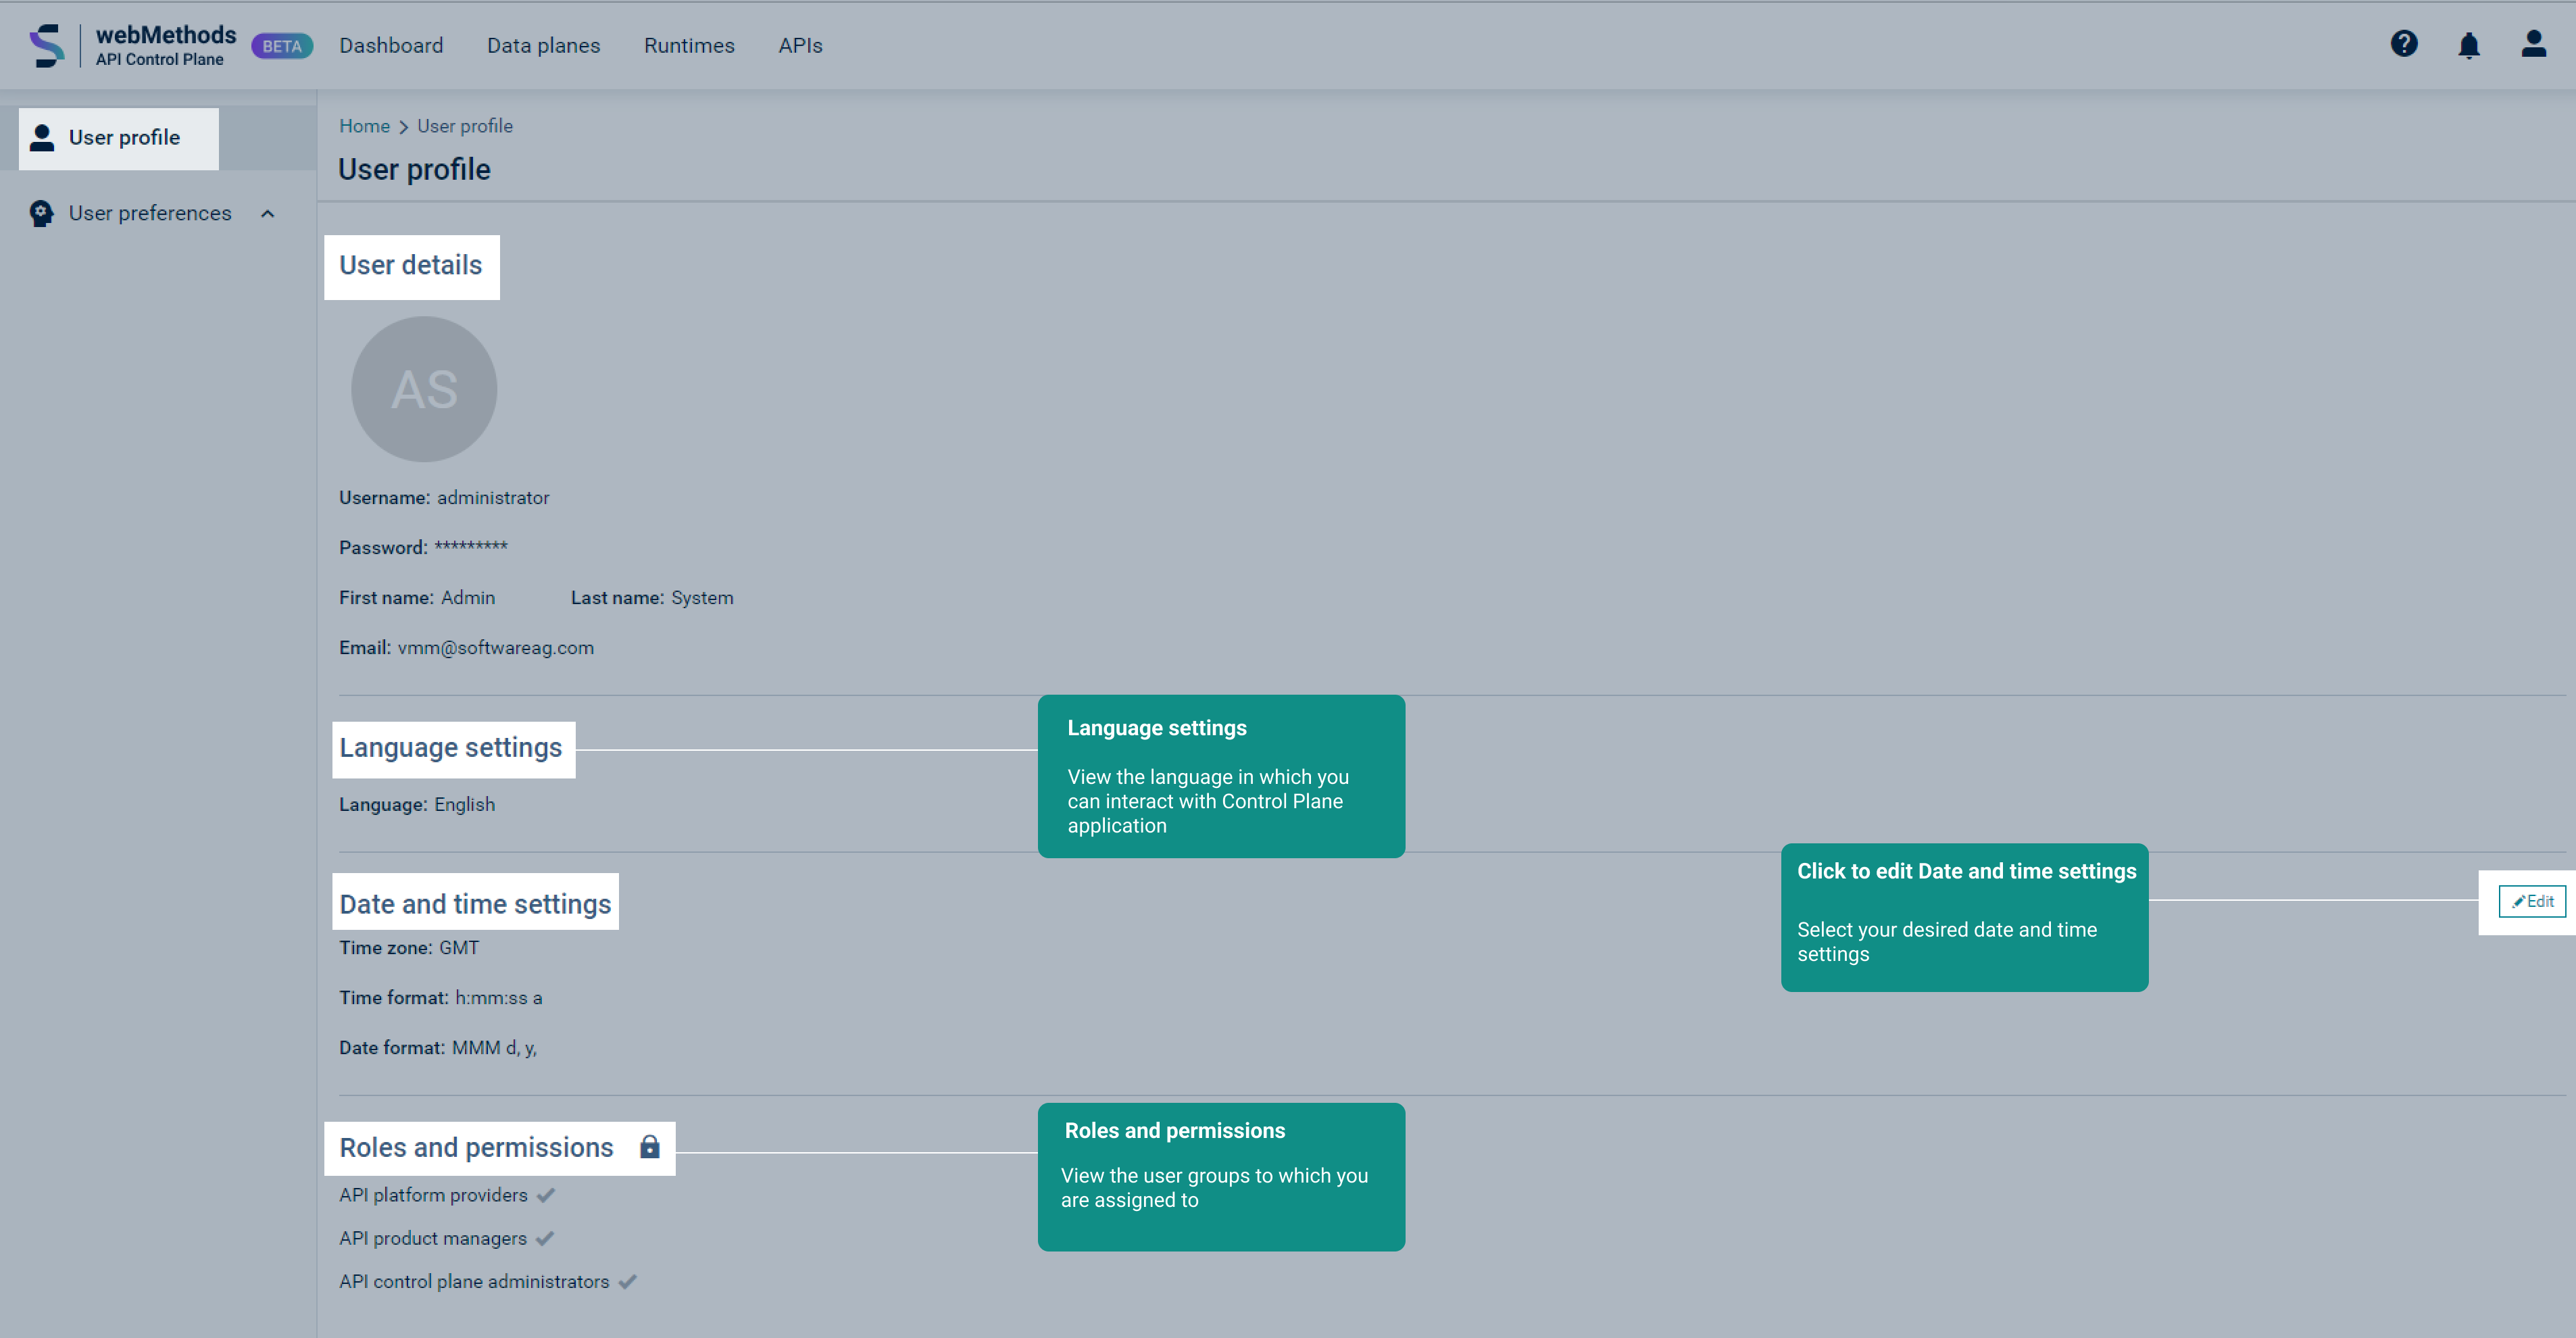
personalize your application through User Profile functionality, which allows you to view and manage user details, date and time settings, language settings, and roles and permissions. The settings that you chose is updated through out the API Control Plane application.
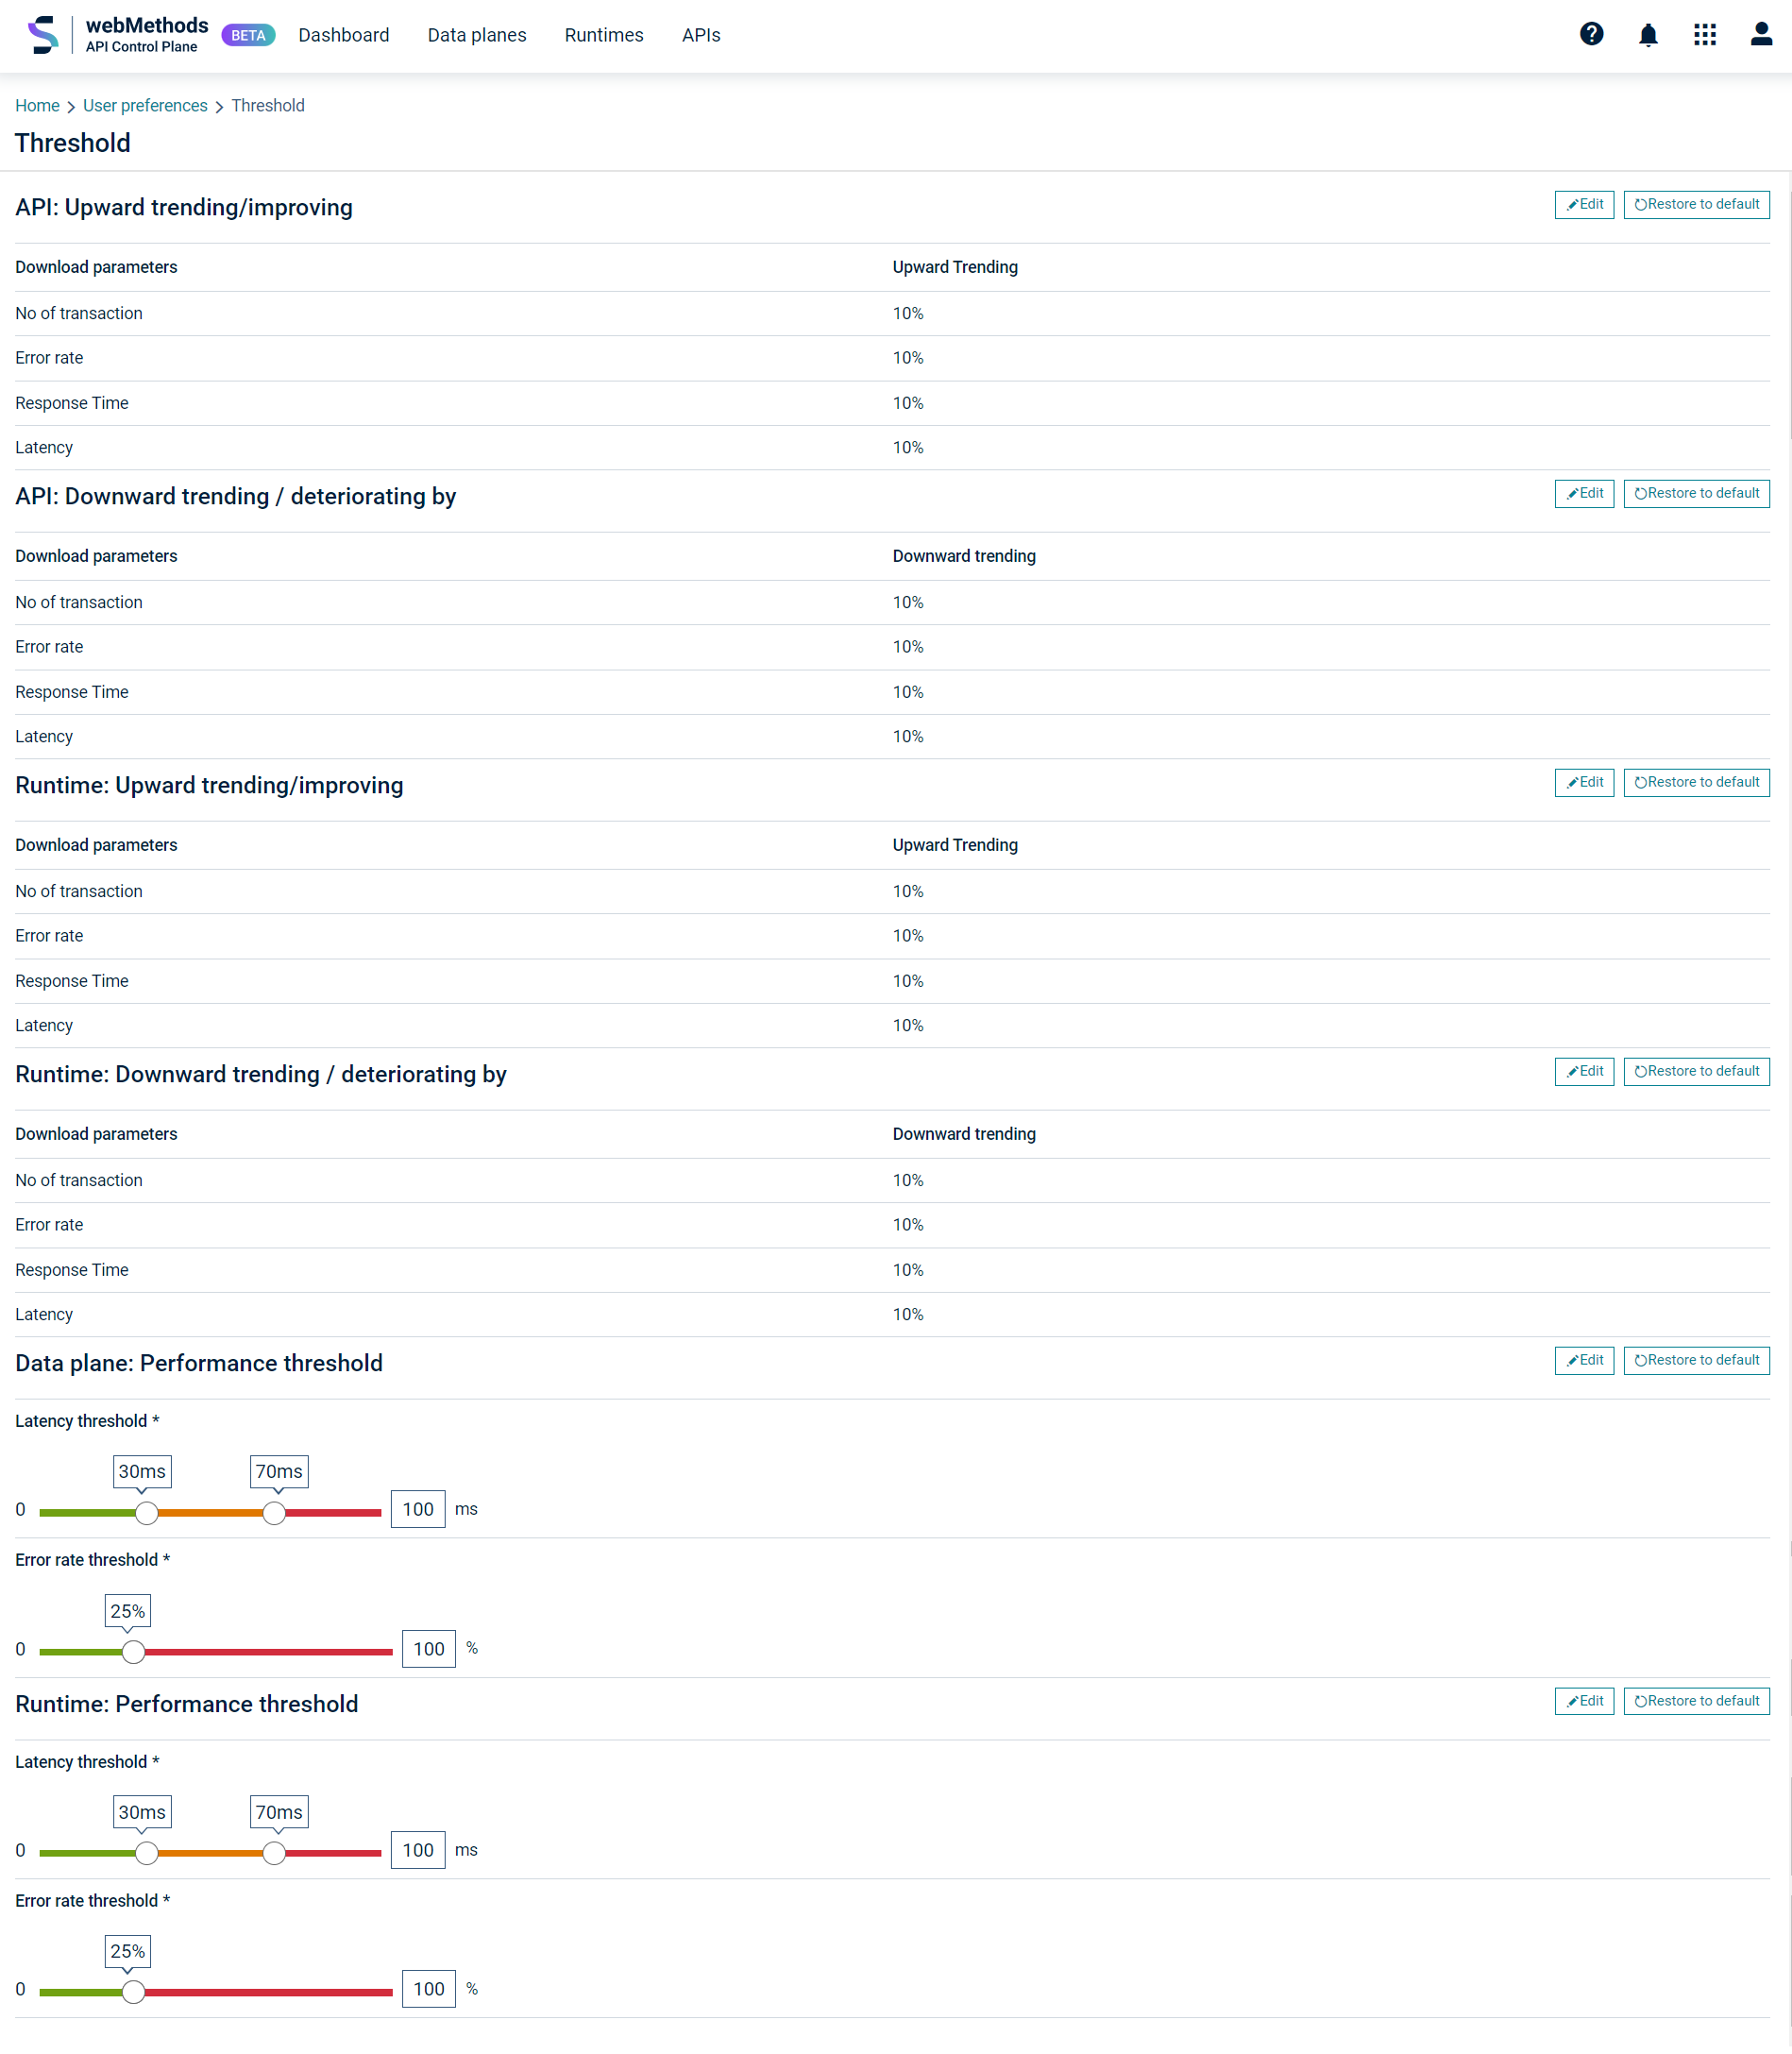
Each user of API Control Plane can customize the way the data is presented in the dashboard and monitoring screens. With the user preferences screen, you can:
set the upward and downward trend thresholds for APIs and runtimes. It also enables you to set the performance thresholds for data planes and runtimes.
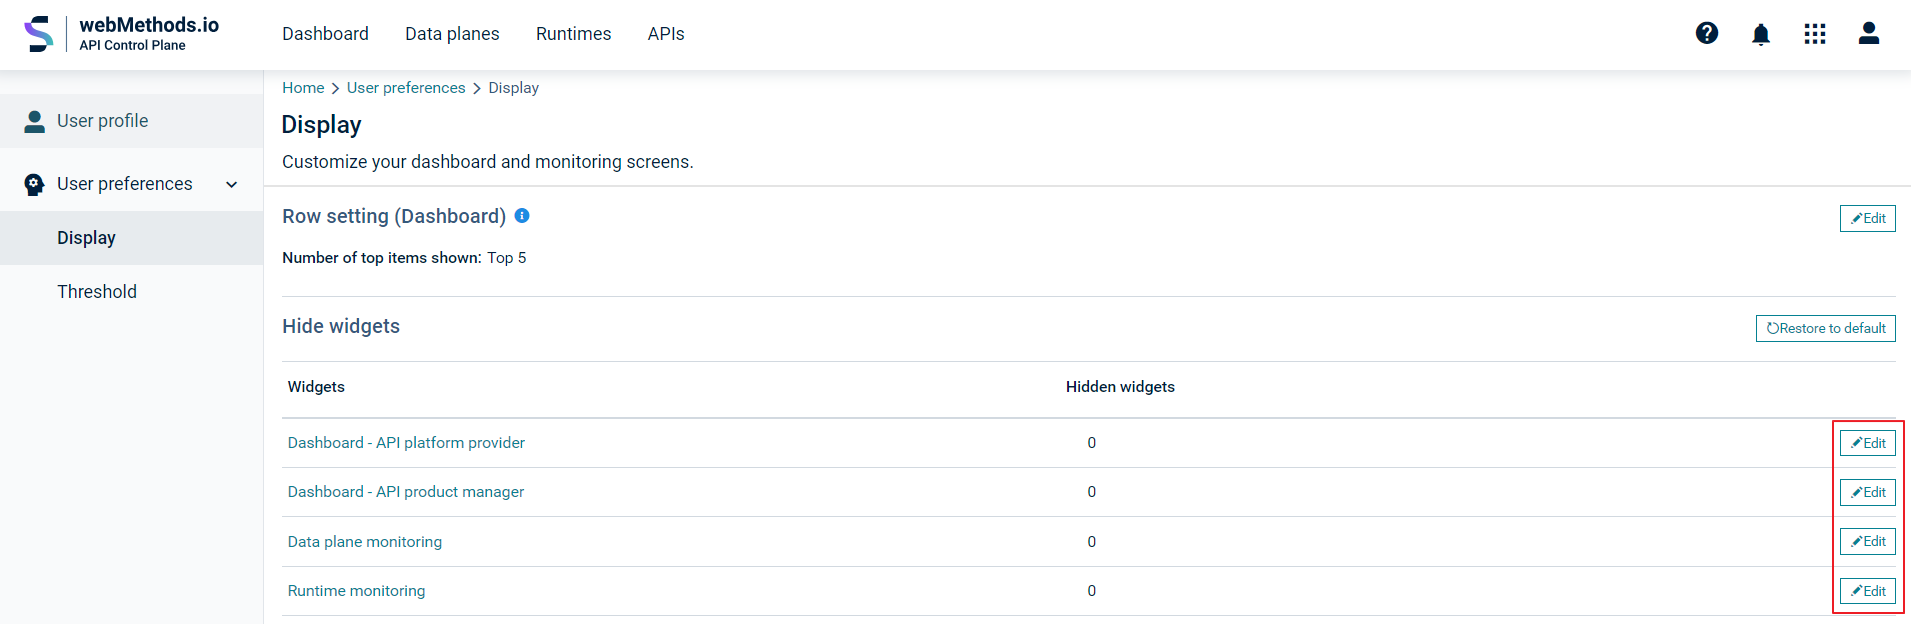
set the number of top trending items to display in all widgets under Top 5 category on your dashboard and monitoring screens.
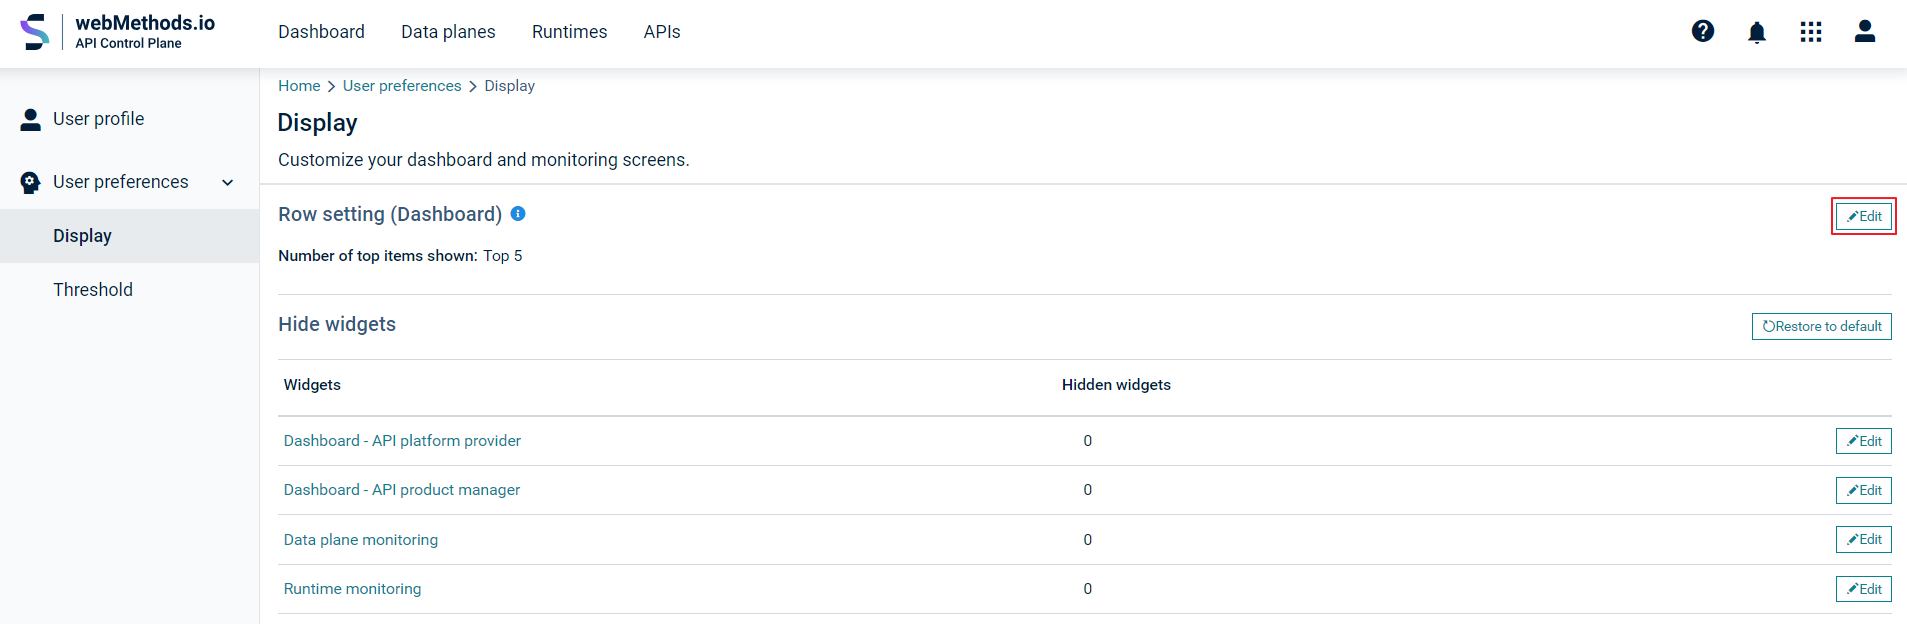
Select the widgets you want to hide from appearing on your dashboard and monitoring screens.
 Read More
This section provides additional information that you require to work with webMethods.io API Control Plane.
This section lists the issues for this release that were known when this release readme was published.
WCO-2417
When the API Control Plane administrator re-assigns the user group for the onboarded Software AG Cloud users and if the Software AG Cloud user logs out and log on to API Control Plane, the Software AG Cloud user is assigned with the default user group instead of the re-assigned user group.