API Gateway Log Aggregation with Fluentd
Fluentd is an open-source tool that helps you collect logs from multiple sources, organize them, and manage the data efficiently.
This section explains how to run API Gateway deployed alongside an external Elasticsearch container and a Fluentd container. The Fluentd container aggregates and forwards log files from an API Gateway container to an external Elasticsearch instance.
Fluentd collects and processes the following logs:
 server.log
. This log file contains the general
API Gateway server activities and error messages, including startup and shutdown processes, application deployment, and other server-level events. The
server.log file is located in the
/opt/softwareag/IntegrationServer/logs directory.
console.log. This log captures standard output (stdout) and standard error (stderr) messages that are usually printed to the console. It includes debug information, warnings, and errors. The
console.log file is located in the
/opt/softwareag/IntegrationServer/logs directory.
APIGatewayUI.log. This log file records activities specific to the
API Gateway user interface. It includes UI-related events, user interactions, and errors encountered within the UI. The
APIGatewayUI.log file is located in the
/opt/softwareag/apigatewayui/logs directory.
The log aggregation configuration consists of the following key components:
1. API Gateway container. Handles API management and routing.
2. External Elasticsearch container. Stores and indexes log data.
3. Fluentd container. Collects and forwards log data from API Gateway to external Elasticsearch.
4. Kibana container. Provides a user interface to visualize and analyze the log data stored in Elasticsearch.

To configure Fluentd for log aggregation
1. Create and configure Docker networks and volumes to ensure the API Gateway and Fluentd containers can communicate and share data.
a. Create an external volume and use it as a shared volume to allow Fluentd to access the log files within the API Gateway container.
Create an external volume using the following command:
docker volume create volume_name
Replace volume_name with the name you want to give your volume.
Verify the volume creation using the following command:
docker volume ls
Check that the created volume appears in the list.
Ensure that the API Gateway and Fluentd containers have read and write permissions to this location and the log files.
b. Create an external network and use it as a shared network to allow Fluentd to connect to the Elasticsearch container used by API Gateway.
Create an external network using the following command:
docker network create network_name
Replace network_name with the name you want to give your network.
Verify the network creation using the following command:
docker network ls
Check that the created network appears in the list.
c. Configure API Gateway, Elasticsearch, and Kibana to use the external network.
To use an external network in your Docker Compose setup, you must define the network as an external network in the networks section of the docker-compose.yml file.
Sample code to define an external network in your Docker Compose setup is as follows:
services:
apigateway:
...
networks:
- network_name
...
elasticsearch:
...
networks:
- network_name
...
kibana:
...
networks:
- network_name
networks:
network_name:
external: true
Replace network_name with the name of your shared network.
d. Configure the API Gateway container to use the external volume.
To share logs with Fluentd using an external volume, you must define the volume in the API Gateway container. This volume is shared between the API Gateway and Fluentd containers.
A sample Docker Compose configuration to configure the API Gateway container is as follows:
services:
apigateway:
...
volumes:
- volume_name:path_to_log_file_within_apigateway_container
...
volumes:
volume_name:
external: true
Replace the placeholders with the actual values:
volume_name. The name of the shared volume.
path_to_log_file_within_apigateway_container. The path to the log files within the
API Gateway container. For example,
/opt/softwareag/IntegrationServer/logs for
server.log and
console.log and
/opt/softwareag/apigatewayui/logs for
APIGatewayUI.log.
2. Configure Fluentd.
a. Create a Fluentd image with plug-ins by building a custom Dockerfile that enables the Fluentd container to process logs and send them to Elasticsearch.
A sample Dockerfile to install the Elasticsearch plug-in and the multi-format-parser plug-in is as follows:
# Start from the official Fluentd image
FROM fluent/fluentd:v1.17-1
# Switch to root user to install plug-ins
USER root
# Install required Fluentd plug-in
RUN gem install fluent-plug-in-elasticsearch
RUN gem install fluent-plug-in-multi-format-parser
# Switch back to the Fluent user
USER fluent
In this Dockerfile:
The Elasticsearch plug-in writes records to Elasticsearch.
The multi-format-parser plug-in helps you parse multiple formats in a single data stream.
Build the Fluentd image using the following command:
docker build -t fluentd_image .
Replace fluentd_image with the name you want to give your Fluentd image.
Verify the Fluentd image creation using the following command:
docker images
Check that the created image appears in the list.
b. Configure Fluentd to use the shared volume and network.
To configure Fluentd to access the API Gateway logs and connect to the Elasticsearch container:
a. Reference the shared volume in the Docker Compose file to allow Fluentd to access the API Gateway logs.
b. Use the shared network in the Docker Compose file to enable Fluentd to connect to the Elasticsearch container.
A sample Docker Compose configuration is as follows:
services:
fluentd:
image: fluentd_image
volumes:
- volume_name:path_to_log_file_within_fluentd_container
networks:
- network_name
...
volumes:
volume_name:
external: true
networks:
network_name:
external: true
Replace the placeholders with the actual values:
fluentd_image. The name of the Fluentd Docker image.
volume_name. The name of the shared volume.
path_to_log_file_within_fluentd_container. The path inside the Fluentd container where the logs are accessible. For example,
/fluentd/apigateway_source/logs.
network_name. The name of the shared network.
c. Create a Fluentd configuration file to process API Gateway container logs and output them as standard output logs.
To provide the Fluentd container with its configuration file, typically named fluent.conf, and located in the fluentd/etc directory within the container, use volume mapping in your service definition.
A sample Docker Compose configuration to provide the configuration file is as follows:
services:
fluentd:
image: fluentd_image
volumes:
- path_to_your_fluentd_configuration_file:/fluentd/etc/fluent.conf
...
Replace fluentd_image with the appropriate image name and path_to_your_fluentd_configuration_file with the path to your configuration file on the host.
Fluentd configuration file
The Fluentd configuration file has the following components:
Input configuration
Filter configuration
Output configuration
Input configuration. Defines the path from where Fluentd must collect logs within the container. This could be files, system logs, or data from other sources. It sets up plug-ins that gather log data and send it to Fluentd. It uses a
multiline parser to parse multiline logs. The
multiline parser uses the
format_firstline and
formatN parameters to parse logs. The
format_firstline parameter identifies the beginning of a multiline log entry, while
formatN, with N ranging from 1 to 20, specifies a sequence of regular expressions that define the structure of the multiline log. For more information about multiline parser, see
Fluentd documentation.
A sample input Fluentd configuration is as follows:
<source>
@type tail
path log_file_within_fluentd_container
tag log_tag
pos_file position_file
<parse>
@type multiline
format_firstline regexp_to_parse_first_line
format1 regexp_to_parse
</parse>
</source>
Replace the placeholders with your actual values:
log_file_within_fluentd_container: This specifies the log file name and path within the Fluentd container. For example,
/fluentd/apigateway_source/logs/server.log.
log_tag: This specifies the tag for incoming logs, which Fluentd uses for filtering and routing. For example,
serverlog.* position_file: This file helps Fluentd keep track of the current position in the log file to handle restarts and avoid reprocessing logs.
regexp_to_parse_first_line: This specifies the regular expression pattern to match the start line of multiple log lines.
regexp_to_parse: This specifies the regular expression pattern to parse individual log lines.
An example input Fluentd configuration snippet for server.log is as follows:
<source>
@type tail
path /fluentd/apigateway_source/logs/server.log
tag serverlog.*
pos_file "/fluentd/log/fluentd-serverlog.pos"
<parse>
@type multiline
format_firstline /\d{4}-\d{2}-\d{2} \d{2}:\d{2}:\d{2}/
format1 /^(?<message>.*)$/
</parse>
</source>
Filter configuration . Allows you to process or transform the log data before it is sent to the output destination. Filters are used for tasks such as parsing, modifying, or enriching logs.
A sample filter configuration is as follows:
<filter log_tag_with_double_asterisks>
@type filter_plug-in
...
</filter>
Replace the placeholders with the actual values:
log_tag_with_double_asterisks: This specifies the tag pattern for incoming logs that you want to filter. For example,
serverlog.** uses double asterisks to ensure that the filter matches all possible variations of tags that start with
serverlog. filter_plug-in: This specifies the specific filter plug-in you want to use. For example,
record_transformer,
parser, and so on.
An example filter configuration for server.log is as follows:
<filter serverlog.**>
@type parser
key_name message
reserve_data true
<parse>
@type regexp
expression /^(?<time>[^\[]*) \[(?<logger>[^\]]*)\][^=]*=(?<thread>[^)]*)\) *(?<inner_message>.*)$/
time_format %Y-%m-%d %H:%M:%S %Z
keep_time_key true
</parse>
@log_level error
</filter>
<filter serverlog.**>
@type parser
key_name inner_message
reserve_data true
<parse>
@type multi_format
<pattern>
format /(?<=\[)[^\[]*\[(?<node>[^\]]+)\]\[[^:]+:(?<correlationId>[^\]]+):/
</pattern>
<pattern>
format /(?<=\[)[^\[]*\[(?<node>[^\]]+)\]/
</pattern>
</parse>
@log_level error
emit_invalid_record_to_error false
</filter>
<filter serverlog.**>
@type record_transformer
enable_ruby
<record>
id apigw-is
file server.log
logLevel ${record["logger"].split('').last == "I" ? "INFO" : record["logger"].split('').last == "W" ? "WARN" : record["logger"].split('').last == "E" ? "ERROR" : record["logger"].split('').last == "D" ? "DEBUG" :record["logger"].split('').last == "T" ? "TRACE" :record["logger"].split('').last == "C" ? "CRITICAL" : record["logger"].split('').last}
fileType APIGatewayServerLogs
timezone +00:00
logFilePath /opt/softwareag/IntegrationServer/logs/server.log
@timestamp ${require 'time'; Time.strptime(record["time"], "%Y-%m-%d %H:%M:%S GMT").utc.iso8601}
timestamp ${record["time"].gsub(' GMT', '+00:00')}
</record>
remove_keys inner_message
</filter>
This Fluentd filter configuration processes log records in three stages. First, it extracts key details from the log message, including the time, logger, thread, and inner_message. Next, it extracts the node and correlationId, if available. Finally, it introduces additional fields, such as a id set to apigw-is, file set to server.log, and fileType set to APIGatewayServerLogs.
Output configuration. Specifies where Fluentd must send the processed log data. It defines an output plug-in to match log events with tags log_tag_with_double_asterisks and send them to the standard output (stdout).
A sample output Fluentd configuration is as follows:
<match log_tag_with_double_asterisks>
@type stdout
</match>
Replace log_tag_with_double_asterisks with the actual tag pattern you want to match.
An example output Fluentd configuration snippet for server.log is as follows:
<match serverlog.**>
@type stdout
</match>
The configuration snippet matches log events with tags starting with serverlog. at multiple levels of hierarchy and sends them to the standard output (stdout).
For a sample
fluent.conf with the input, filter, and output configurations, see
Fluentd.conf. You can modify the configuration fields to meet your specific requirements. For example,
timezone.
3. Start the containers and check the end-to-end flow of log data from API Gateway to Elasticsearch, and view the logs in Kibana.
a. Start the containers using docker-compose and verify that they are running.
A sample command to start your containers using Docker Compose is as follows:
docker-compose -f docker_compose_file_name up -d
b. Use the docker ps command to check that the containers are up and running.
This command lists all the running containers. You should see entries for API Gateway, Fluentd, Elasticsearch, and Kibana containers.
c. Check the Fluentd standard output.
A sample command to view the Fluentd standard output is as follows:
docker logs Fluentd_containerId
Replace Fluentd_containerId with the actual container ID of your Fluentd container. You can find the container ID from the docker ps output.
An example of Fluentd standard output is as follows:
2024-08-01 07:23:48.472847359 +0000 serverlog.fluentd.apigateway_source.logs.server.log: {"message":"2024-08-01 07:23:48 GMT [YAI.0001.0212I] (tid=532) [default][apigw-01][APIGW:5de9397c-7942-4b30-924f-8dcaa6a176e4:532:ea8127b4779548bdaba189bb6d5e9f33] activate service: BayernRest (1.0) ","time":"2024-08-01 07:23:48 GMT","logger":"YAI.0001.0212I","thread":"532","node":"apigw-01","correlationId":"5de9397c-7942-4b30-924f-8dcaa6a176e4:532","id":"apigw-is","file":"server.log","logLevel":"INFO","fileType":"APIGatewayServerLogs","timezone":"+00:00","logFilePath":"/opt/softwareag/IntegrationServer/logs/server.log","@timestamp":"2024-08-01T07:23:48Z","timestamp":"2024-08-01 07:23:48+00:00"}
d. Update the Fluentd configuration file to send logs to an external Elasticsearch container instead of standard output by including the appropriate output configurations.
A sample configuration that directs Fluentd to send logs with tags starting with log_tag to the Elasticsearch container at http://elasticsearch_host:elasticsearch_port, storing them in the apigateway_log_index index is as follows:
<match log_tag_with_double_asterisks>
@type elasticsearch
hosts http://elasticsearch_host:elasticsearch_port
index_name apigateway_log_index
type_name _doc
flush_interval flush_interval
<buffer>
@type memory
...
</buffer>
</match>
An example of output configuration for logs like server.log, console.log, or APIGatewayUI.log is as follows:
<match serverlog.** consolelog.** apigwuilog.**>
@type elasticsearch
hosts http://elasticsearch:9200
index_name "#{ENV['APIGWLOGINDEX']}"
type_name _doc
flush_interval 1s
<buffer>
@type memory
flush_interval 2s
chunk_limit_size 1m
queue_limit_length 1
</buffer>
</match>
The APIGWLOGINDEX environment variable specifies the index name where logs are stored in Elasticsearch. You can configure this in the Fluentd service's environment section as follows:
environment:
- APIGWLOGINDEX=gateway_default_log
Here, default represents the tenantId of your API Gateway.
e. Enable HTTP RPC in the Fluentd configuration to manage the Fluentd instance through HTTP endpoints and reload the configuration.
Enable HTTP RPC by adding the rpc_endpoint configuration to the Fluentd configuration file.
<system>
rpc_endpoint 0.0.0.0:HTTP_endpoint
</system>
Replace HTTP_endpoint with the port you want to use for the RPC endpoint. For example, to use port 24444:
<system>
rpc_endpoint 0.0.0.0:24444
</system>
This configuration makes the Fluentd RPC interface available on all network interfaces (0.0.0.0) at the specified port. 24444 port is often used for Fluentd's RPC endpoint for control or monitoring purposes.
Ensure that the port used for HTTP RPC (24444 in this case) is mapped in your Docker service configuration. Update the Docker Compose file to include port mapping.
An example of port mapping for Fluentd service is as follows:
ports:
- 24224:24224
- 24224:24224/udp
- 24444:24444
This configuration maps the RPC port 24444 from the container to the host, allowing you to manage Fluentd through HTTP RPC. The other ports (24224) are used for the Fluentd data input and output.
f. Enable log aggregation with a dynamic Fluentd configuration update by updating the Fluentd configuration file with Elasticsearch output and HTTP RPC settings.
Invoke the following API to trigger Fluentd to reload its configuration without interruption:
curl --location --request GET 'http://fluentd_host:HTTP_endpoint/api/config.reload'
An example command to trigger Fluentd to reload its configuration without stopping is as follows:
curl --location --request GET 'http://localhost:24444/api/config.reload'
The sample response for the command is as follows:
{
"ok": true
}
To ensure that Fluentd aggregates logs to external Elasticsearch during API Gateway startup, follow these steps:
a. Start the API Gateway, external Elasticsearch, and Kibana containers, and verify that all components are operational.
b. Launch the Fluentd container with the output configuration set for external Elasticsearch.
c. Restart the API Gateway container. Ensure that the gateway_tenantId_log index exists in external Elasticsearch beforehand, as this allows Fluentd to collect and process logs generated during API Gateway startup phase effectively.
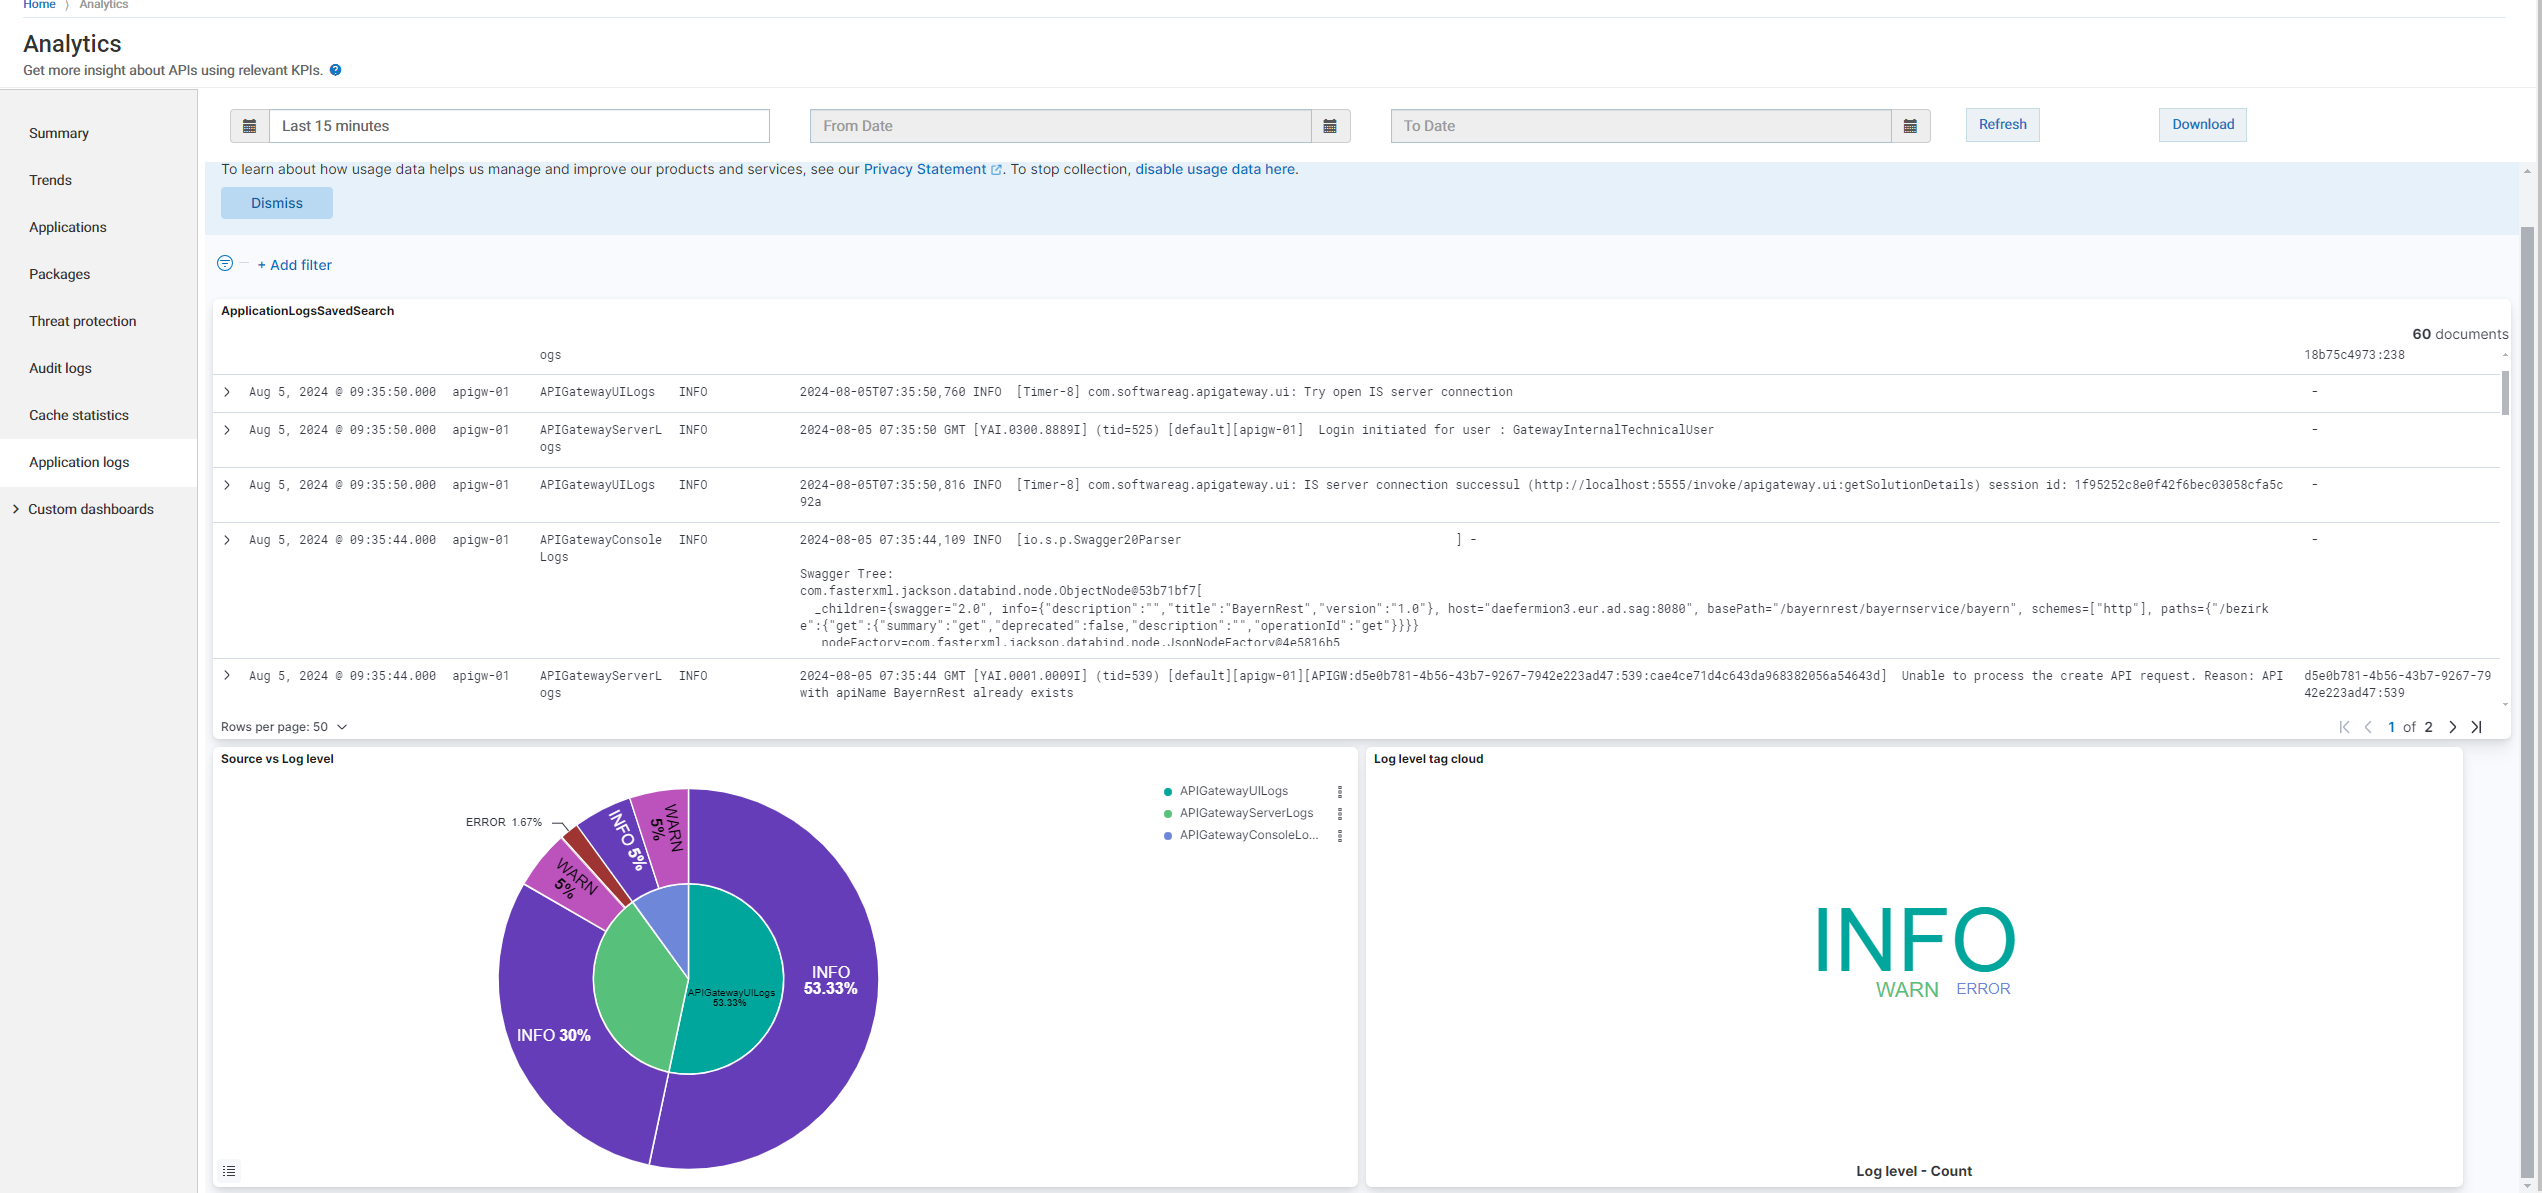
g. Verify that the logs are correctly sent to Elasticsearch and visible in Kibana dashboard under Menu options  > Analytics > Application logs.